Tyler Huntley 2020 Passing Stats
Updated
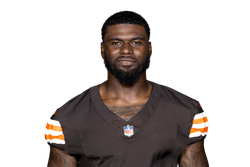
Tyler Huntley
IR

 ·
QB
·
NFL
·
16,688 views
FPPG (DK, 2020)
—
Pass Yds
15
Pass TDs
—
INTs
—
Tyler Huntley (QB, Baltimore Ravens) 2020 passing stats — completions, passing yards, touchdowns, interceptions, and yards per attempt, tracked game by game and season by season.
Season-by-Season Passing Full passing stats for every regular season on record, plus a combined career total.
| Season | Games | Comp | Att | Comp % | Yards | Yds/G | TDs | TDs/G | INTs |
|---|---|---|---|---|---|---|---|---|---|
| 2026 | 5 | 76 | 110 | 69.1% | 727 | 145.4 | 4 | 0.80 | 1 |
| 2025 | 5 | 52 | 67 | 77.6% | 426 | 85.2 | 2 | 0.40 | 0 |
| 2024 | 5 | 86 | 133 | 64.7% | 829 | 165.8 | 3 | 0.60 | — |
| 2023 | 5 | 21 | 37 | 56.8% | 203 | 40.6 | 3 | 0.60 | 0 |
| 2022 | 6 | 75 | 112 | 67.0% | 658 | 109.7 | 2 | 0.33 | 3 |
| 2021 | 7 | 122 | 188 | 64.9% | 1081 | 154.4 | 3 | 0.43 | 4 |
| 2020 | 2 | 3 | 5 | 60.0% | 15 | 7.5 | — | 0.00 | — |
| Career | 35 | 435 | 652 | 66.7% | 3939 | 112.5 | 17 | 0.49 | 8 |
Get Tyler Huntley's full passing splits and Next Gen air-yards data with FTA+.