
NBA DFS Ownership Projections
Real-Time Ownership Data for Today's DraftKings & FanDuel Basketball Slates
Start Your 3-Day Free Trial
Try Free →Ownership Data Built Into the Optimizer
NBA ownership projections are integrated directly into the FTA lineup optimizer. See projected ownership % for every player alongside salary, projections, and value scores — then use that data to build differentiated tournament lineups or match the field in cash games. All in one tool.
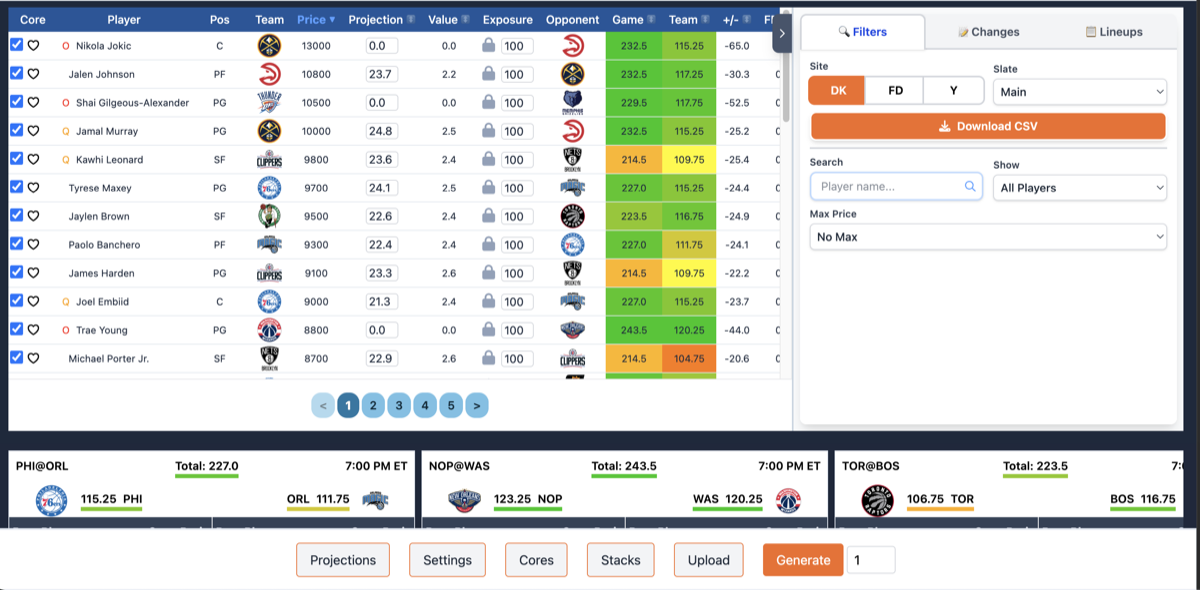
NBA Ownership Data in the FTA Optimizer
When you open the FTA optimizer, every player on the slate includes a projected ownership percentage alongside their salary, projection, and value score. This data updates in real-time as injury news breaks, lineup confirmations come in, and contest locks approach. Here's what you get:
Projected Ownership %
See how heavily each player will be rostered across DraftKings and FanDuel contests. Identify chalk and find low-owned leverage plays.
Real-Time Updates
Ownership projections update throughout the day as news breaks, injuries are reported, and lineup locks approach.
Platform-Specific Data
Ownership differs between DraftKings and FanDuel due to scoring and salary differences. See site-specific projections for each.
Integrated with Projections
Ownership data sits alongside projected points, salary, and value — so you can spot over-owned and under-owned players instantly.
Exposure Controls
Set ownership-based exposure limits when generating lineups. Cap exposure to chalk or force in low-owned contrarian plays.
Auto-Optimized Lineups
The optimizer factors ownership into lineup generation, building differentiated tournament entries or chalk-heavy cash lineups.
How to Use Ownership Data for DFS
Cash Game Strategy
In cash games (50/50s, double-ups), match the field by rostering popular plays. High-ownership players in positive spots reduce variance and protect your bankroll. Focus on floor over ceiling and roster the chalk confidently.
Tournament Strategy
In GPPs (tournaments), differentiation is key. Target low-owned players (under 10%) with high ceilings to create leverage. When your contrarian picks hit and the chalk busts, you vault up the leaderboard while the field falls flat.
Finding Leverage Plays
The best leverage plays are low-owned players with projections similar to high-owned alternatives at the same salary range. Swap the chalk for the leverage play — same expected output, but far fewer opponents benefit when they hit.
Understanding DFS Ownership Patterns
What Drives High Ownership
Players become highly owned when they have an obvious positive narrative: favorable matchup, injury to a teammate increasing their role, low salary relative to production, or heavy media coverage. The more consensus the narrative, the higher the ownership.
Identifying Chalk Traps
A chalk trap occurs when a player's ownership exceeds their expected value. This happens when narratives inflate ownership beyond what the projection supports. Compare projected ownership to projected points — if a player is 30% owned but only the 15th-best projection at their position, they may be a chalk trap worth fading in tournaments.
Low-Owned Value Targets
The best low-owned plays are "hidden" behind a lack of narrative. A player in a neutral matchup with a moderate salary and no headline news may project similarly to a chalk play but carry single-digit ownership. These are the leverage goldmines that win tournaments.
Related NBA DFS Tools
NBA Ownership Data
Full ownership projections for all slates
DraftKings NBA Optimizer
Build optimized DFS lineups with ownership data
NBA DFS Optimizer
Full optimizer for DraftKings & FanDuel
NBA DraftKings Picks
Today's top DFS plays for DraftKings
NBA FanDuel Picks
Today's top DFS plays for FanDuel
NBA Player Props Today
Best +EV prop bets with projections
Frequently Asked Questions
- What are DFS ownership projections?
- DFS ownership projections estimate the percentage of lineups in a contest that will roster each player. For example, if a player has 25% projected ownership, roughly 1 in 4 lineups will include them. Ownership data is derived from factors like salary, matchup quality, news coverage, and recent performance. Understanding ownership is critical for both cash game and tournament strategy.
- How do ownership projections help in DFS?
- In tournaments (GPPs), low-owned players who hit provide massive leverage since fewer opponents benefit. High-owned 'chalk' plays are safer for cash games where you want to match the field. Ownership projections let you identify which players the field is overvaluing (fade candidates) and undervaluing (leverage plays), enabling smarter lineup construction.
- What is a chalk play in DFS?
- A 'chalk' play is a player with very high projected ownership - typically 20%+ in large-field tournaments. Chalk players are usually in obvious positive spots (favorable matchup, injury to teammate, low salary relative to projection). While chalk is safe for cash games, over-relying on chalk in tournaments limits your upside since you'll have the same players as much of the field.
- How accurate are DFS ownership projections?
- Modern ownership projections are highly accurate for identifying relative popularity - they correctly identify which players will be the most and least owned. Absolute percentages can vary, but the rank ordering is reliable. Our projections update in real-time as news breaks, injury reports are released, and lineup locks approach, improving accuracy throughout the day.
- Should I fade high-ownership players?
- Not automatically. The key is finding players who are over-owned relative to their projection. A player at 30% ownership who is correctly priced offers no edge - but a 30% owned player in a difficult matchup with limited upside is a fade candidate. The best tournament strategy targets low-owned players with high ceilings while selectively including chalk that is fairly priced.
Get Premium NBA DFS Tools
Weekly
-
Weekly payments
-
Cancel anytime
-
Lineup optimizer
-
Ownership projections
-
Live chat
-
Draft guide access
Already have an account? Sign in
Monthly
-
Save Over $10/month vs weekly
-
Monthly payments
-
Cancel anytime
-
Lineup optimizer
-
Ownership projections
-
Live chat
-
Draft guide access
Already have an account? Sign in
Annual
-
Save Over $200/year vs weekly
-
Best value
-
Annual payments
-
Cancel anytime
-
Lineup optimizer
-
Ownership projections
-
Live chat
-
Draft guide access
Already have an account? Sign in