NFL Yards Per Rush Attempt Leaders 2026
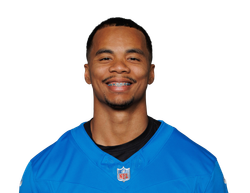
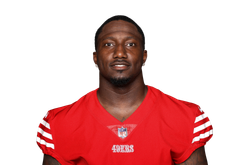
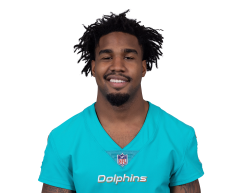
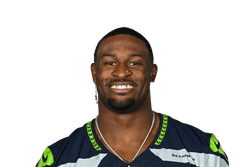
This page ranks every NFL running back and other ball carriers by yards gained per rush attempt in 2026, updated after each week of games. Yards per attempt measures pure rushing efficiency independent of workload, helping separate backs who are breaking tackles and creating explosive plays from those who are simply getting a high volume of carries — a useful lens for spotting efficient committee backs and evaluating offensive line and scheme impact. Use the filters below to narrow the 2026 yards per attempt leaders by position or team, or search for a specific player to see where they rank.
| # | Player | Team | Pos | GP | Yards Per Rush Attempt ▼ | Proj |
|---|---|---|---|---|---|---|
| 1 |   |
WR | 9 | 18.5 | ||
| 2 |   |
WR | 5 | 16.0 | ||
| 3 |   |
WR | 9 | 16.0 | ||
| 4 |   |
WR | 9 | 13.0 | ||
| 5 |   |
WR | 6 | 13.0 | ||
| 6 |   |
P | 9 | 12.0 | ||
| 7 | |
WR | 8 | 12.0 | ||
| 8 |   |
QB | 3 | 11.7 | ||
| 9 | |
WR | 9 | 11.5 | ||
| 10 | |
WR | 9 | 11.0 | ||
| 11 |   |
WR | 9 | 11.0 | ||
| 12 |   |
QB | 2 | 10.0 | ||
| 13 |   |
WR | 8 | 9.8 | ||
| 14 | |
WR | 10 | 9.7 | ||
| 15 |   |
WR | 9 | 9.7 | ||
| 16 |   |
WR | 9 | 9.3 | ||
| 17 |   |
QB | 2 | 9.0 | ||
| 18 |   |
WR | 9 | 9.0 | ||
| 19 |   |
QB | 1 | 8.7 | ||
| 20 |   |
WR | 9 | 8.5 | ||
| 21 |   |
WR | 8 | 8.0 | ||
| 22 | |
QB | 1 | 8.0 | ||
| 23 | |
RB | 7 | 7.7 | ||
| 24 | |
QB | 5 | 7.6 | ||
| 25 | |
WR | 9 | 7.5 |











Loading more...