NFL Week 10 DFS Ownership Projections
The essential DraftKings & FanDuel ownership tool — track projected ownership percentages to find leverage plays and build winning NFL lineups.
255 DraftKings & 248 FanDuel players projected tonight
Updated 8:11 PM ET
Average error: 2.6 ownership points across 23,561 player projections this season
NFL DFS ownership projections for the Week 10 Main slate (DraftKings), updated 8:11 PM ET: the highest-owned plays are Bijan Robinson (32.4%), Justin Jefferson (23.1%), Chuba Hubbard (21.7%).


 +17
 DraftKings
Main
Classic · Sun, Nov 15 · 1:00 PM ET
+21
DraftKings
Sun-Mon
Classic · Sun, Nov 15 · 1:00 PM ET
+11
DraftKings
Early Only
Classic · Sun, Nov 15 · 1:00 PM ET


 +3
DraftKings
Afternoon Only
Classic · Sun, Nov 15 · 4:05 PM ET


 +1
DraftKings
Mon-Thu
Classic · Mon, Nov 16 · 8:15 PM ET


 +1
DraftKings
Primetime
Classic · Sun, Nov 15 · 8:20 PM ET
DraftKings
LAC @ BAL
Showdown · Mon, Nov 16 · 8:15 PM ET


 DraftKings
MIN @ GB
Showdown · Sun, Nov 15 · 1:00 PM ET
DraftKings
KC @ ATL
Showdown · Sun, Nov 15 · 1:00 PM ET


 DraftKings
BUF @ NYJ
Showdown · Sun, Nov 15 · 1:00 PM ET


 DraftKings
JAX @ TEN
Showdown · Sun, Nov 15 · 1:00 PM ET


 DraftKings
CAR @ NO
Showdown · Sun, Nov 15 · 1:00 PM ET


 DraftKings
MIA @ IND
Showdown · Sun, Nov 15 · 1:00 PM ET
DraftKings
HOU @ CLE
Showdown · Sun, Nov 15 · 1:00 PM ET


 DraftKings
NE @ DET
Showdown · Sun, Nov 15 · 9:30 AM ET

 DraftKings
SEA @ LVR
Showdown · Sun, Nov 15 · 4:05 PM ET
DraftKings
LAR @ ARI
Showdown · Sun, Nov 15 · 4:05 PM ET


 DraftKings
SF @ DAL
Showdown · Sun, Nov 15 · 4:25 PM ET
DraftKings
PIT @ CIN
Showdown · Sun, Nov 15 · 8:20 PM ET
QB
23 players


Unlock every player's ownership
See every player's projected ownership on DraftKings & FanDuel — chalk, leverage plays, and showdown captains, not just the top of the board.
Unlock Ownership DataRB
39 players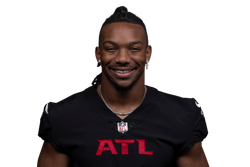
RBATL$8,200
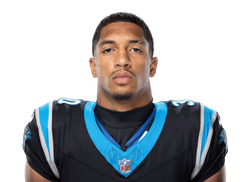
RBCAR$7,200
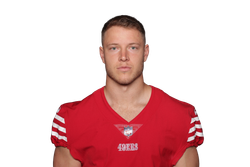
RBSF$8,500
WR
76 players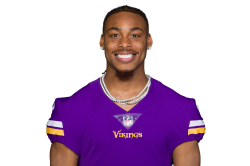
WRMIN$6,800

WRNO$7,000

WRATL$6,600
TE
39 players
TEIND$4,400
TELAR$3,000
TESF$6,500
DST
20 players
DSTGB$2,900
DSTIND$3,000
DSTHOU$3,400
Showdown Ownership — UTIL & Captain
NE @ DET · Showdown · Locks Sun, Nov 15 · 9:30 AM ET
Full showdown board →
Unlock every player's showdown ownership
See UTIL and Captain/MVP ownership for every player on this slate's showdown board — not just the free preview.
Unlock Ownership Data+ 25 more players on this slate, plus every other NFL showdown and classic board.
UTIL is a player's projected ownership in a flex slot; CPT is his projected ownership in the Captain/MVP slot — two different figures, not one restated.
Showdown, Afternoon/Early and primetime ownership is projected from a smaller player pool than the main slate, so expect wider swings.
Single-game ownership is projected by the same models as the main slate and updates continuously until lock.
Who are the highest-owned NFL DFS players on DraftKings this week?
Tyler Shough ($5,600) leads quarterbacks at 16.5% projected ownership. Shough projects for 3.5x value this week, the best value of the top-owned quarterbacks. Brock Purdy is next at 11.7%, then Josh Allen third at 11.2%. Purdy projects for 3.1x value this week. Allen projects for 3.2x value this week. Shough is 4.8 points clear of Purdy.
Bijan Robinson ($8,200) tops running backs with 32.4% projected ownership. Robinson projects for 2.6x value this week, the best value of the top-owned running backs. Chuba Hubbard ranks second at 21.7%, then Christian McCaffrey ranks third at 19.7%. Hubbard projects for 2.5x value this week. McCaffrey projects for 2.5x value this week. That's a 10.7-point gap over the next-highest running back.
Justin Jefferson ($6,800) is the most-owned play among wide receivers at 23.1% projected ownership. Jefferson projects for 2.5x value this week, the best value of the top-owned wide receivers. Chris Olave sits right behind at 20.9%, then Drake London sits third at 18.9%. Olave projects for 2.3x value this week. London projects for 2.3x value this week. That's a 2.2-point gap between the top two wide receivers.
Tyler Warren ($4,400) paces tight ends at 20.9% projected ownership. Warren projects for 2.9x value this week, the best value of the top-owned tight ends. Colby Parkinson follows at 20.3%, then George Kittle rounds out the top three at 12.3%. Parkinson projects for 2.8x value this week. Kittle projects for 2.3x value this week. Parkinson trails Warren by 0.6 points.
Green Bay Packers ($2,900) leads defense/special teams units at 10.5% projected ownership. Packers projects for 3.0x value this week. Indianapolis Colts is next at 10.2%, then Houston Texans third at 10.1%. Colts projects for 3.1x value this week, the best value of the top-owned defense/special teams units. Texans projects for 2.9x value this week. Only 0.3 points separate the top two defense/special teams units.
How these ownership projections are measured
FTA's ownership models are machine-learning models that retrain and re-predict around the clock as news, lineups, and salaries change, so the projections keep getting sharper as a slate approaches. The NFL model's average error is 2.6 ownership points across 23,561 graded player projections.
 FanDuel

NFL ownership moves fastest in the two days before kickoff. Weather, inactives, and injury designations can turn a forgotten punt play into the slate's chalk, so the number you see Friday morning and the number locked at 1 PM Sunday are often not the same number.
Main-slate ownership tends to cluster around a handful of game stacks, usually a quarterback and his top target sharing a slice of the field. Showdown and primetime boards concentrate even harder, since there is only one game to choose from and the obvious captain play can end up in a third of every lineup. Use the ownership column to see where that concentration is building before you decide whether to join it or fade it.
Ready to put this ownership data to work? Use our NFL DFS lineup optimizer to build lineups that use ownership projections for DraftKings and FanDuel.
How ownership is projected
FTA's ownership projections come from machine-learning models that weigh salary, projected production, matchup quality, and recent usage trends, then keep retraining as news, lineups, and odds shift — so the numbers sharpen the closer a slate gets to lock. A player's ownership isn't just a readout of his projection; it also reflects how obvious, or hidden, a value play looks next to everyone else on the slate.
Frequently Asked Questions
What are NFL DFS ownership projections?
- Ownership projections estimate the percentage of DFS lineups that will roster a specific NFL player in a given contest. Popular quarterbacks in high-total games and elite receivers in smash matchups regularly draw 20-35% ownership, while punt-priced running backs filling in for injured starters can spike even higher. Everyone else typically sits under 10%. Ownership is sometimes called roster percentage — the two terms mean the same thing.
How do ownership projections help in NFL DFS tournaments?
- In NFL GPPs, rostering a low-owned player who goes off creates massive leverage — if a 6%-owned tight end scores two touchdowns, lineups with that tight end leap the field. Pairing strong projections with sub-10% ownership on one or two core plays is how most large-field tournament winners differentiate their lineups.
How does NFL game stacking interact with ownership?
- A QB + 1-2 pass-catcher stack is standard in NFL DFS, but the most profitable stacks are the ones with low combined ownership. A 15%-owned QB paired with a 6%-owned WR from the same team gives you correlation upside without the field owning the same stack. Check the ownership column when building your Sunday stacks.
When are NFL DFS ownership projections available?
- Projections are published once DraftKings and FanDuel release their slates, typically Monday or Tuesday for the main Sunday slate. Ownership updates throughout the week as injury designations, practice reports, and weather forecasts come in — check back Saturday night and Sunday morning for the most accurate final estimates.
What's the difference between classic and showdown/captain ownership?
- On showdown (single-game) slates, a player's ownership splits into two separate numbers: his flex/utility ownership and his Captain ownership, since the Captain spot carries its own 1.5x points and 1.5x salary on DraftKings and is chosen independently from the rest of the lineup. What usually matters is his combined exposure across both roles — that's the real measure of how crowded he is.
How are NFL ownership projections calculated?
- FTA's ownership models retrain and re-predict around the clock as news, lineups, and salaries change, so projections keep sharpening the closer the slate gets to kickoff. A clear role at an affordable salary in a high-total game is usually what pushes a player toward the top of the ownership board.